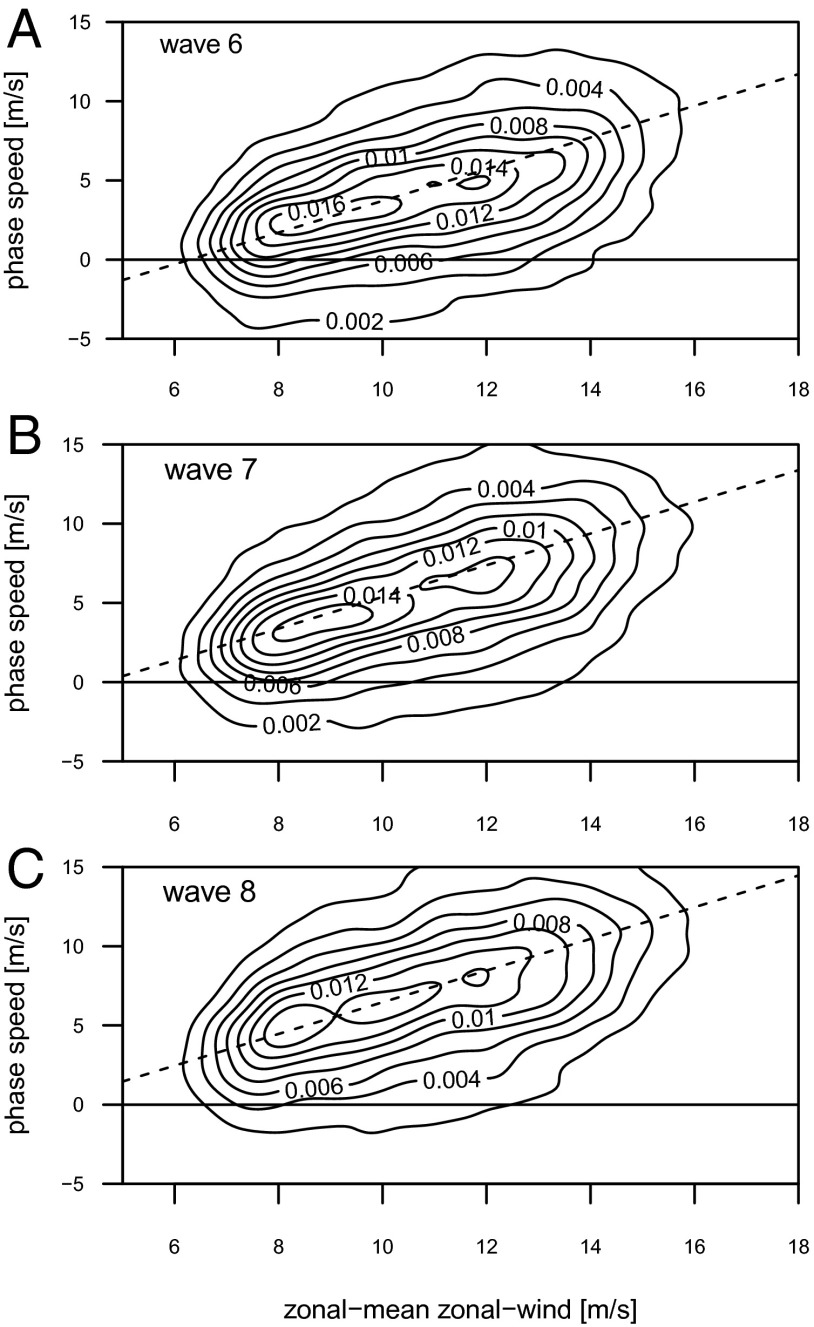
Fig. 1.
The 2D probability density distributions for daily values of the zonal mean zonal wind (U) and wave phase speed (c) at 500 mb aggregated from 35°N to 65°N for the 1979–2012 period for (A) wave 6, (B) wave 7, and (C) wave 8 for all calendar days. The dashed line shows the linear relationship given by Eq. 1.

