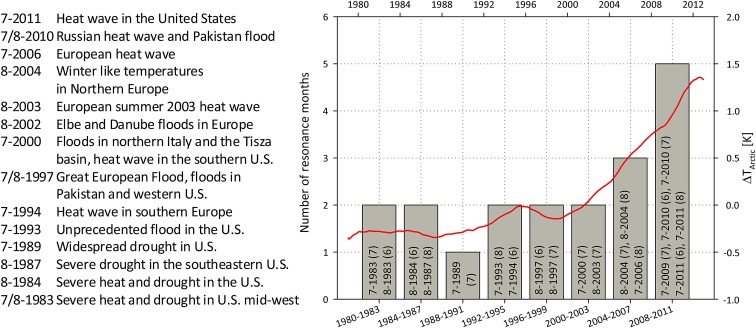
Fig. 2.
Number of July and August resonance months identified by Petoukhov et al. (16) for eight 4-y periods from 1980 to 2011. Text in the gray bars indicates the actual months with, in brackets, the wave number involved in resonance, and the table on the left lists the associated extreme weather events (adapted from ref. 16). The red line plots the difference of surface warming in the Arctic (north of 65°N) and in the rest of the Northern Hemisphere (south of 65°N), illustrating the much more rapid surface warming in the Arctic since 2000.

