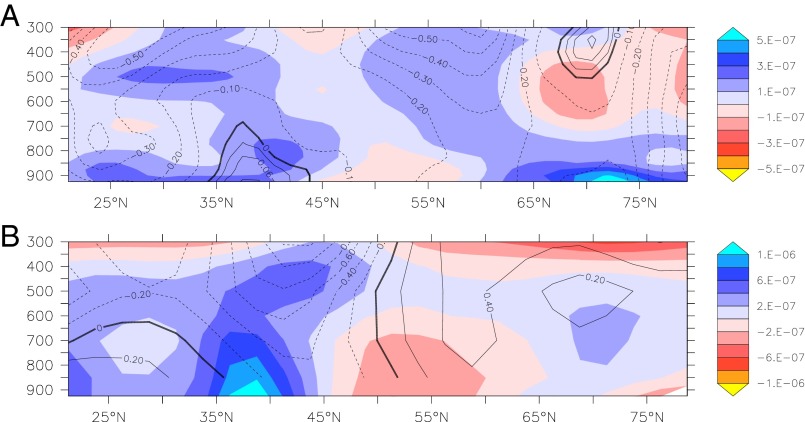
Fig. 7.
(A) Anomaly in poleward thermal gradient (color contours) in degrees Centrigrade per meter and zonal mean zonal wind (contour lines) in meters per second for July−August in 2000–2012 compared with 1979–1999. Negative anomalies (red) strengthen the magnitude and positive anomalies (blue) weaken the magnitude of the thermal gradient. Solid contours indicate an amplification of the zonal mean zonal wind and dashed contours indicate a weakening. (B) Same as in A but showing anomalies for 2081–2100 compared with 1981–2000 of the multimodel mean of the CMIP5 set of climate projections under scenario RCP8.5.

