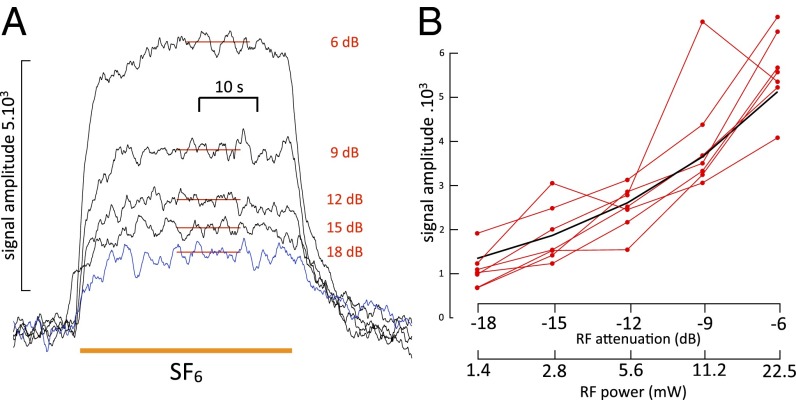
Fig. 3.
(A) Effect of variations in incident RF power on the amplitude of the SF6-induced spin change. Note that the onset shows a small step change even at the higher attenuations, which is probably caused by a transient temperature increase of the preparation briefly exposed to room temperature SF6 gas until the latter cools to 6 °C. The 18-dB trace is shown in blue to facilitate comparison of onset and end. Amplitude measurements were accordingly made by subtracting the signal after recovery from the average value of the signal during a steady-state period during exposure, which is indicated by the red horizontal bars in the traces. (B) SF6 signal amplitude as a function of RF power in seven different experiments (red lines). The black trace is the expected relationship if the signal is proportional to the square root of power. A signal value of 5,000 at 6 dB was chosen to position the calculated curve amid the experimental data.

