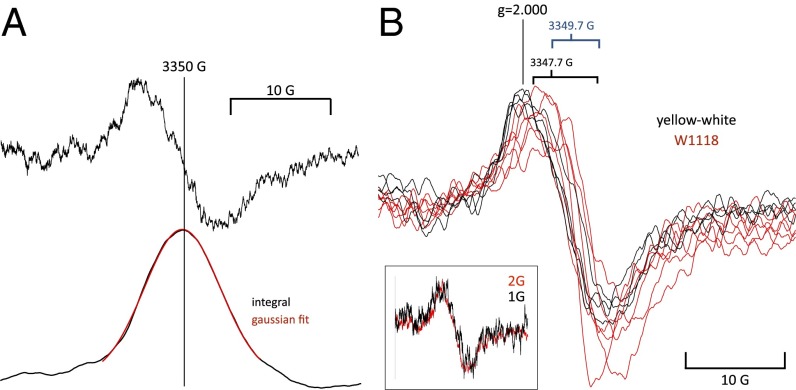
Fig. 4.
(A, Upper) The SF6-induced spin signal obtained by subtracting averaged signals from 20 sweeps in N2 from the same in SF6. (A, Lower) The same signal integrated to show the shape of the absorption line. The red line fit to the central section of the signal is a Gaussian curve with an SD of 5.2 G. (B, Inset) Line shape of the SF6-induced spin change measured at 2- and 1-G modulation depth. The 1-G trace is noisier, but the line shape is unchanged, showing that measurements at 2-G modulation do not distort it. Superimposed traces from five WT (red) and four yellow-white (black) experiments showing that, despite some variation in both amplitude and midpoint magnetic field value, the signals are of similar shape and show no obvious features attributable to hyperfine structure.

