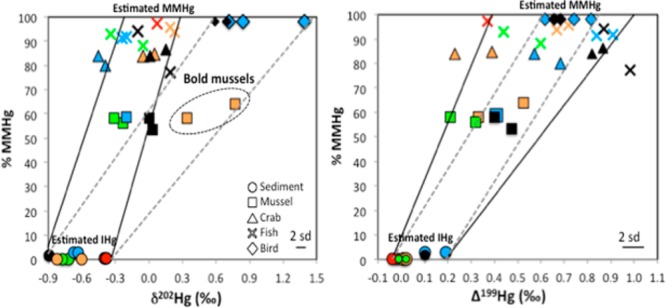
Figure 2.

Plot of % MMHg versus δ202Hg (a) and Δ199Hg values (b) of estuarine sediments and biota. Each site is represented by a different color; BUZZ (black), WELLS (blue), BARN (green), BOLD (orange), and MILL (red). The solid lines represent the range of estimated MMHg isotopic composition needed to explain sediments, crabs, and fish. The dotted lines represent the range of estimated MMHg isotopic composition needed to explain mussels from BOLD and birds from BUZZ and WELLS. The “estimated MMHg” and “estimated IHg” represent the ranges of Hg isotopic composition extrapolated for 100% MMHg and 100% IHg, respectively, based on the linear regression of % MMHg vs δ202Hg and Δ199Hg. Analytical uncertainty is indicated by the error bar (2 SD).
