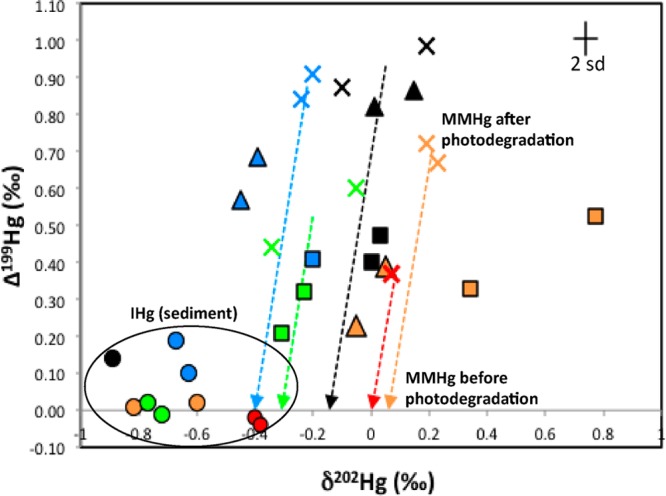
Figure 3.

Plot of δ202Hg and Δ199Hg values of all sediments and aquatic biota. Each site is represented with different colors; BUZZ (black), WELLS (blue), BARN (green), BOLD (orange), and MILL (red). Symbols are the same as Figure 2. The arrows represent the experimentally derived photochemical degradation slope for MMHg. Analytical uncertainty is indicated by the error bar (2 SD).
