Figure 4.

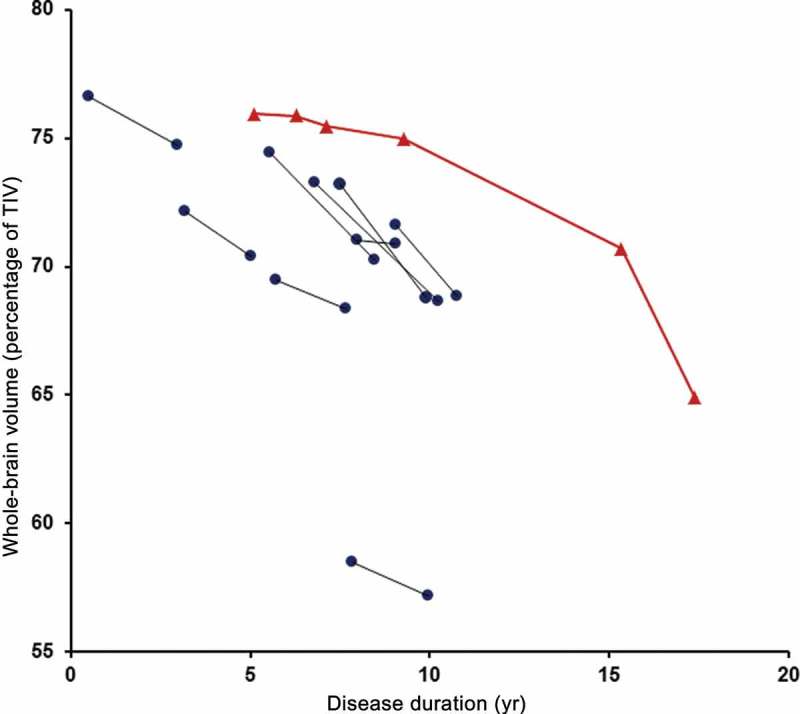
Longitudinal whole brain volumes (as percentage of total intracranial volume) for • MAPT mutation cases and ▴ CW against disease duration. [To view this figure in colour, please see the online version of this Journal.]

Longitudinal whole brain volumes (as percentage of total intracranial volume) for • MAPT mutation cases and ▴ CW against disease duration. [To view this figure in colour, please see the online version of this Journal.]