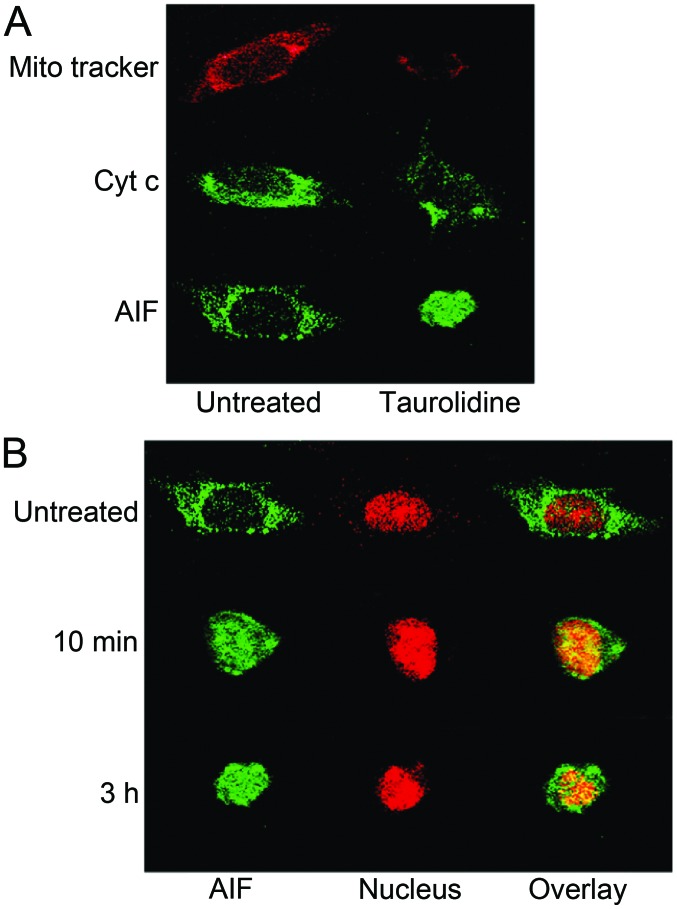
Figure 2.
Initiation of the mitochondrial response pathway by Taurolidine (19). (A) Confocal microscopy images demonstrating Taurolidine-induced loss of mitochondrial membrane potential (red, visualized by MitoTracker) and translocation of Apoptosis-Inducing-Factor (AIF, green) from mitochondria to the nucleus in LN229 glioma cells after 2 h of Taurolidine treatment with 100 μg/ml. In contrast, cytochrome c (represented by the green punctate immunostaining) was not released. (B) Time dependency of the Taurolidine effect. AIF translocation, cell shrinkage, and nuclear condensation (chromatin stained red with PI) are detectable within 10 min after Taurolidine (100 μg/ml) treatment. For details see ref. 19.

