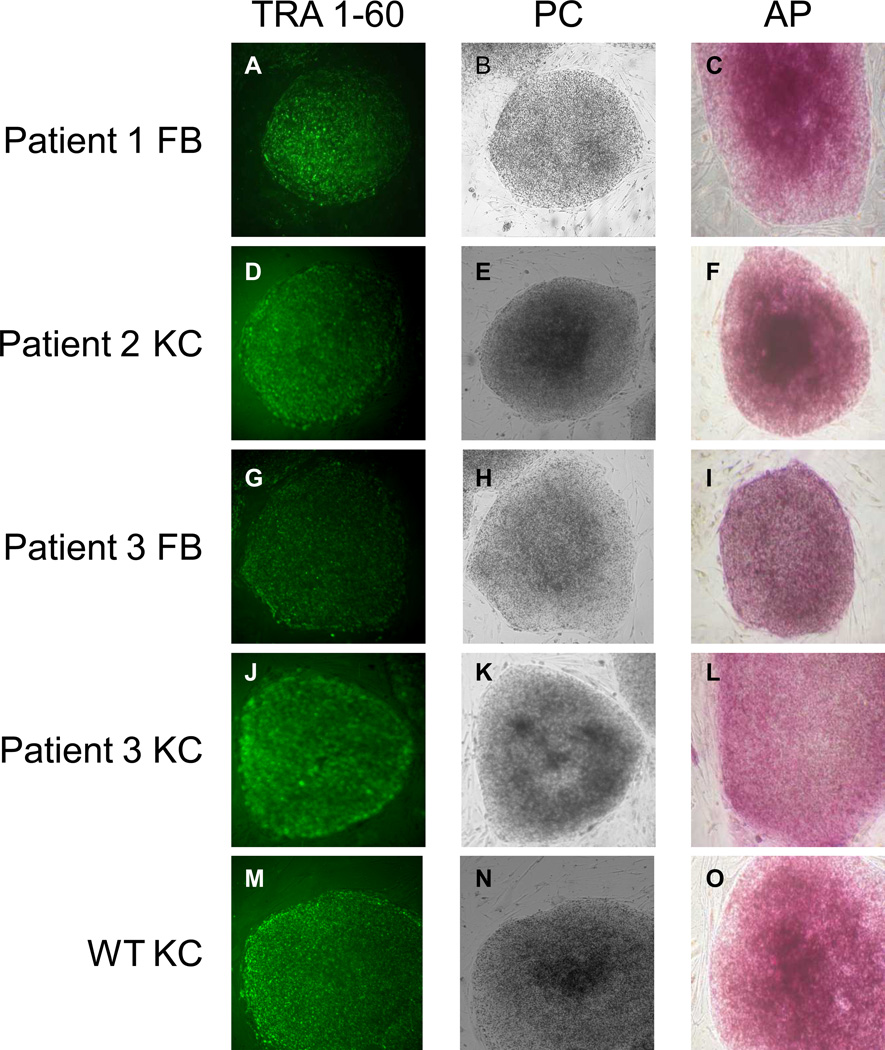
Figure 1. Induction of RDEB skin cells into RDEB iPS cells.
A, D, G, J, M: Live human iPS cultures stained with TRA-1-60 antibody four weeks after transduction. B, E, H, K, N: Phase contrast image of the same iPS colonies. C, F, I, L, O: Alkaline phophatase stain. P: Quantitative RT-PCR analysis of OCT4, SOX2, NANOG, KLF4, c-MYC, LIN28, and DNMT3b expression levels in RDEB KC iPS cells from P2 and P3 relative to expression levels in parental RDEB KCs from P2 and P3. Q: Quantitative RT-PCR analysis of the same genes in WT KC- iPS cells relative to expression levels in parental WT KCs. All values were normalized against endogenous GAPDH expression. FB, fibroblasts; KC, keratinocytes; WT, wild type; PC, phase contrast; AP, alkaline phosphatase; iPS, induced pluripotent stem cells.

