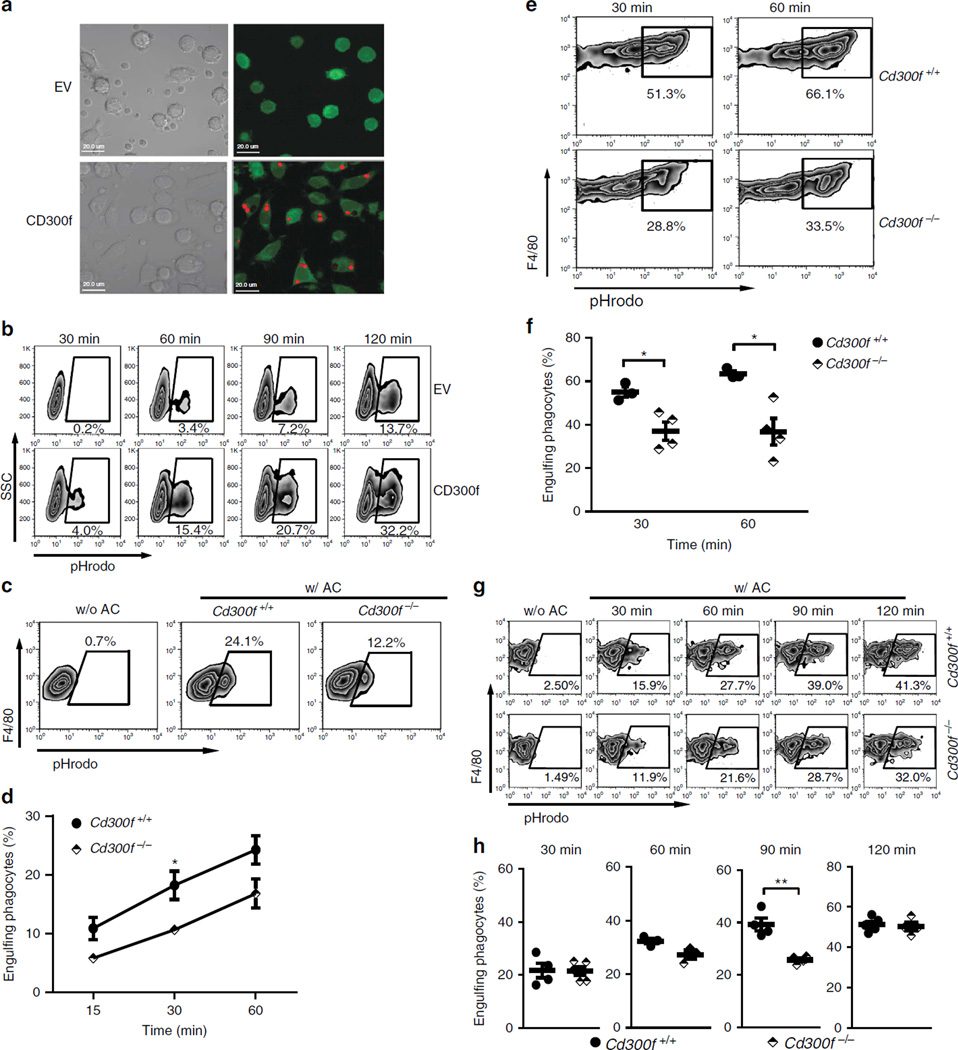
Figure 1. CD300f positively regulates the phagocytosis of AC.
(a) CFSE-labelled L929 cells (green), transduced with empty virus (EV) or lentivirus encoding CD300f, were mixed with pHrodo-labelled AC at a 1:15 ratio. After 2 h, the cells were mounted on a slide in the pH 8.8 buffer (to quench pHrodo fluorescence signal from non-engulfed AC) and analysed by confocal microscopy. The engulfed pHrodo-labelled ACs are red; the differential interference contrast (DIC) images are shown on the left. Scale bars, 20 µm. (b) L929 cells, transduced with the indicated constructs, were mixed with pHrodo-labelled AC at a 1:3 ratio for the indicated times. Cells were suspended in the pH 8.8 buffer and analysed for the percentage of pHrodo+ cells, representing the cells that engulfed AC. (c,d) Primary alveolar cells isolated from three wt or Cd300f−/− mice were incubated with pHrodo-labelled AC at a 1:3 ratio for the indicated times (w/AC) or left alone (w/o AC). Cells were stained with anti-mouse F4/80 Ab and analysed for the percentage of F4/80+ pHrodo+ cells from F4/80-positive population, representing the macrophages that engulfed AC. The plots (c) illustrate the gating strategy used; numbers indicate the percentage of F4/80+ pHrodo+ cells. The graph (d) shows means ± s.e.m. (error bars), n=3. (e,f) Peritoneal cells isolated from wt or Cd300f−/− mice were treated and analysed as in c) with gating on F4/80+ CD11b+ cells. The plots (e) illustrate the gating strategy used. The graph (f) shows means ± s.e.m. (error bars) for three wt and four Cd300f−/− mice; data are representative from three experiments. Asterisks in (d) and (f) indicate statistical significance (*P<0.05, Student’s t-test). (g) BMDM from wt and Cd300f−/− mice were mixed with pHrodo-labelled AC and analysed as in (c). The data shows a representative result from three experiments. (h) pHrodo-labelled ACs (1 × 10⁶) were intraperitoneally injected into wt and Cd300f−/− mice. At the indicated time points, peritoneal cells were collected, labelled with anti-mouse F4/80 and anti-mouse CD11b Ab and analysed as in (c). The data show means ± s.e.m. (error bars) for four wt and Cd300f−/− mice, and are representative of three experiments. Asterisks indicate statistical significance (**P<0.01, Student’s t-test).

