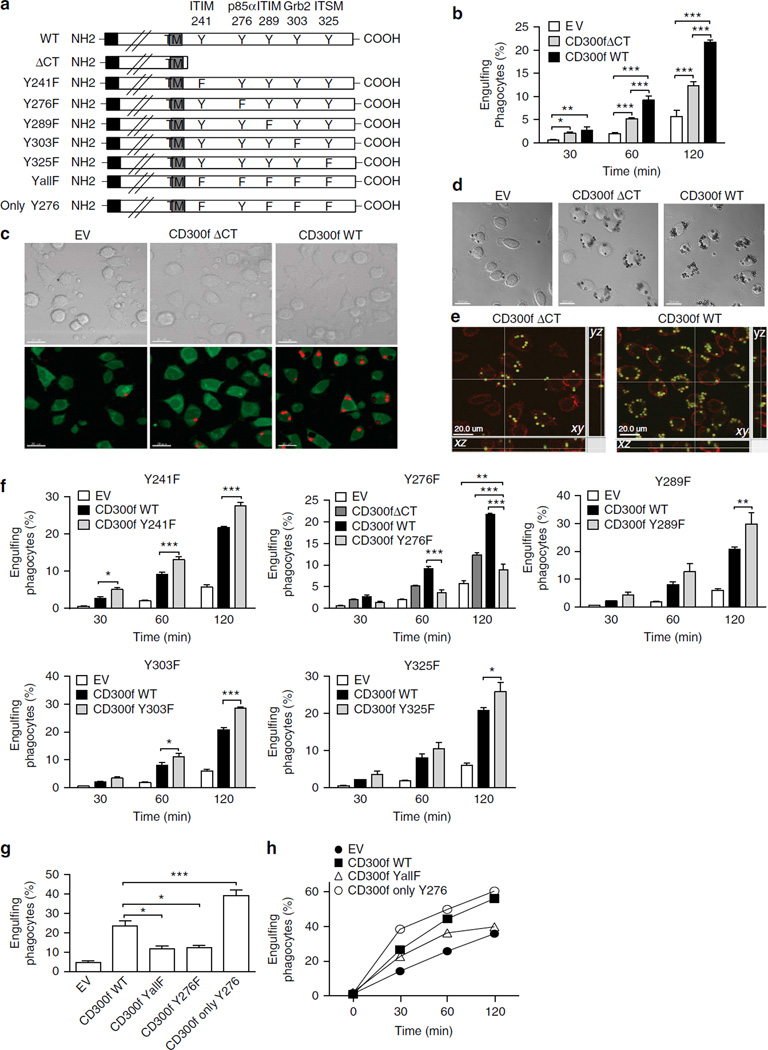
Figure 3. The tyrosine-based motifs in CD300f cytoplasmic tail initiate signals that differentially regulate the phagocytosis of AC.
(a) Schematic representation of CD300f and its mutants used in the study. The amino-acid number of tyrosine residues located within putative tyrosine-based signalling motifs is indicated at the top. For the visualisation purpose, the size of extracellular portion is reduced and drawn not to scale. (b) L929 cells transduced with the indicated constructs were mixed with TFL-4-labeled AC at a 1:3 ratio for the indicated times. Cells were then fixed and analysed by flow cytometry for the percentage of cells containing AC, as for Fig. 2a. The graph shows means with s.e.m. (error bars) from three experiments; asterisks indicate statistical significance (*P<0.05, **P<0.01, ***P<0.001; two-way analysis of variance, ANOVA). (c) CFSE-labelled L929 cells, transduced with the indicated constructs, were mixed with pHrodo-labelled AC at a 1:15 ratio. After 2 h, the cells were analysed by confocal microscopy as for Fig. 1a. The top row shows the DIC images; the bottom row shows the CFSE-labelled L929 cells (green) and the engulfed pHrodo-labelled AC (red). Scale bars, 20 µm. (d,e) L929 cells transduced with the indicated constructs were mixed with PS liposome-coated beads for 1 h. Cells were washed, fixed, permeabilized, stained by phalloidin and analysed by confocal microscopy. Representative single optical sections are shown in DIC images in (d). The images in (e) show the images in all three axes; F-actin is red, green indicates the auto-fluorescence of liposome-coated beads; scale bars, 20 µm. (f,g) L929 cells stably transduced with the indicated constructs were mixed with TFL-4-labeled AC at a 1:3 ratio for the indicated times. Cells were fixed and analysed by flow cytometry as in Fig. 2a. The graphs show the mean values with s.e.m. (error bars) from three experiments; asterisks indicate statistical significance (*P<0.05, **P<0.01, ***P<0.001; two-way ANOVA in f, Student’s t-test in g). (h) BMDM from Cd300f−/− mice transduced with the indicated constructs were mixed with pHrodo-labelled AC at a 1:3 ratio for the indicated times, suspended in basic buffer and analysed by flow cytometry as in Fig. 1. The graph illustrates the representative of three experiments.

