
Figure 2.
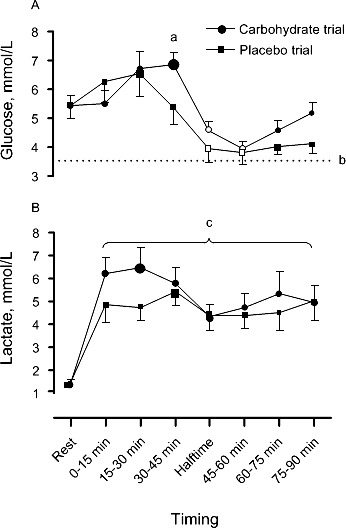
A, Blood glucose concentrations and B, blood lactate concentrations during the carbohydrate and placebo trials. The large data point indicates peak value, and the hollow data point indicates the within-trials difference (P ≤ .05) from peak value. a Indicates a difference between trials at the corresponding time point (P ≤ .05). b Broken horizontal line represents the hypoglycemic threshold (63.06 mg/dL [3.5 mmol/L]). c Indicates a time effect relative to rest (P ≤ .05).