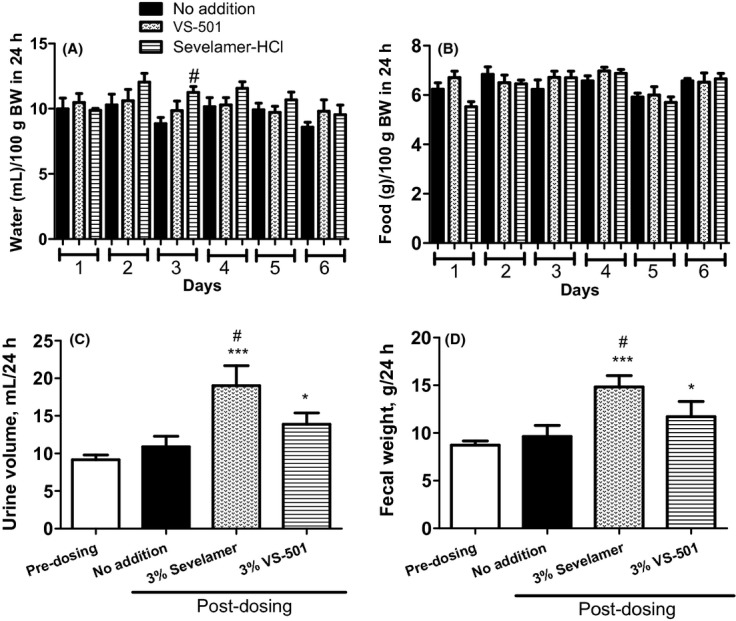
Figure 3.

Water and food consumption versus urinary volume and fecal weight in normal rats on normal diet. Male SD rats were on normal diet plus 3% VS-501 or sevelamer-HCl as described in Figure 2. Water and food consumption for each rat was tracked daily. Urine and feces samples were collected for 24 h at two different time points (predosing and on Day 6 after dosing) as described in Methods. Mean ± SE was calculated for each group. (A) Water consumption in 24 h normalized by body weight. (B) Food consumption in 24 h normalized by body weight. (C) Urine volume in 24 h. (D) Fecal weight in 24 h. One-way ANOVA and Dunnett test with 95% confidence intervals of difference was performed for statistical comparisons. *P < 0.05, ***P < 0.001 versus predosing. #P < 0.05 versus no addition (untreated).
