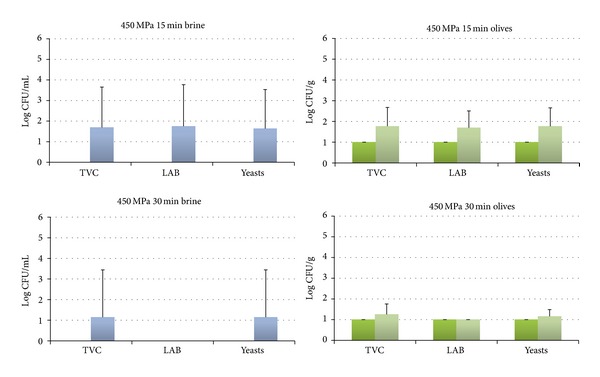
Figure 3.

Changes in the population of the indigenous microbiota in brines at day 0 (dark blue) and day 7 (light blue) and in olives at day 0 (dark green) and day 7 (light green) treated at 450 MPa for 15 or 30 min. The detection limit of the enumeration method was 0 log CFU/mL for brines and 1 log CFU/g for olives. Data are mean values ± standard deviation of duplicate pouches analyzed from three different batches of olives.
