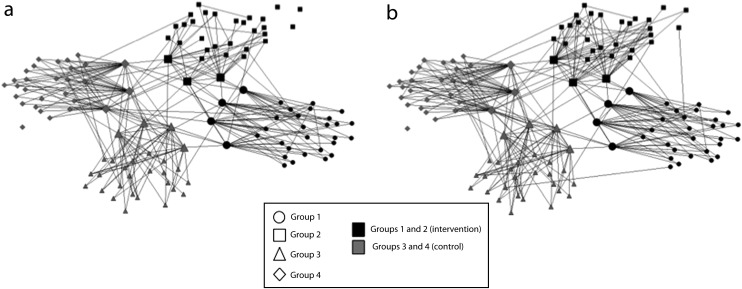
FIGURE 1—
Visual representations of each of the 4 social network groups at (a) baseline and (b) follow-up: Harnessing Online Peer Education (HOPE) intervention; Los Angeles, CA; September 2010–February 2011.
Note. Large nodes indicate that the individual was a peer leader. The sample size was n = 112.

