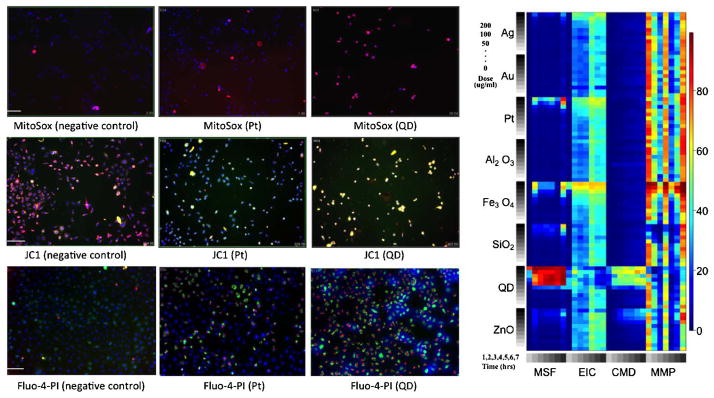
Fig. 1.

Fluorescence images and heat map of raw data. On the left are fluorescence images of RAW cells treated with various nanomaterials (quantum dot, platinum and a negative control) and dyed with compatible dye combinations including MitoSox, JC1, PI and Fluo-4. The subsequence fluorescence read-out, measured at varying wavelengths, provides a measure of the number of cells positive for the response. On the left is a heat map of the raw data for each particle and outcome. Colder colors indicate a smaller percentage of cells positive for the response and warmer colors indicate a larger percentage of cells positive for the response.
