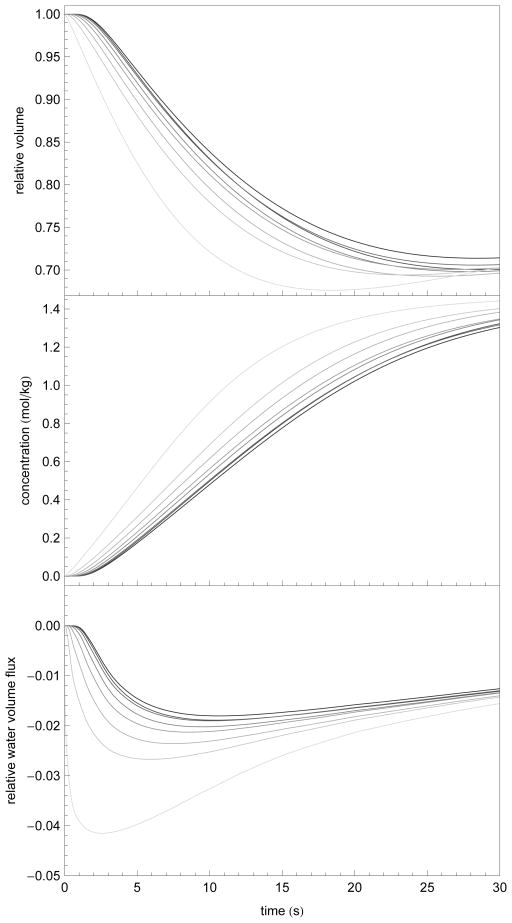
Figure 7.
Numerical simulation of normalized individual islet volumes, intracellular solute concentration, and normalized water flux (w(0)−1dw/dt) at each of eight layers (light to dark indicates exterior to interior layers) after exposure to 1.532 mol/kg EG 1 x PBS at 22 °C. These data demonstrate the predicted intraislet delay in response, the reduced total volume response, and the time to quasiequilibrium as a function of cell depth. The initial radius was the mean radius from Table 2 (r = 94 μm) and Ais was set to the mean interstitial area (Ais= 0.54).

