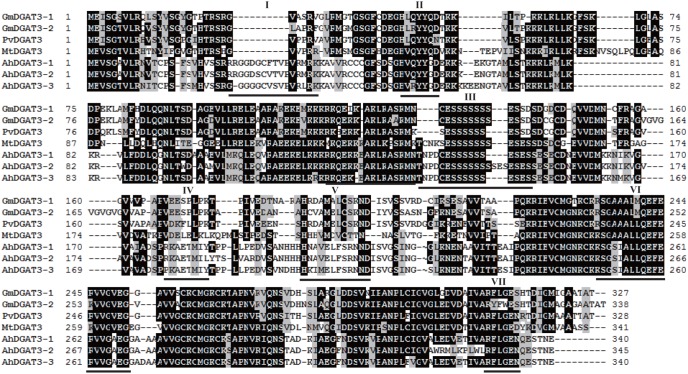
Figure 2. Homology comparison of the amino acid sequences of AhDGAT3 with DGAT3s from other plant species.
Identical amino acid residues are highlighted in black. The phosphopantetheine attachment site is underlined and designated as block ‘I’. The potential DGAT motif is underlined and designated as block ‘II’ and ‘V’. The putative thiolase acyl-enzyme intermediate signature is underlined and designated as block ‘III’. The putative Tyr kinase phosphorylation site is underlined and designated as block ‘IV’. The fatty acid binding protein signature is underlined and designated as block ‘VI’. The putative catalytic active site is underlined and designated as block ‘VII’.

