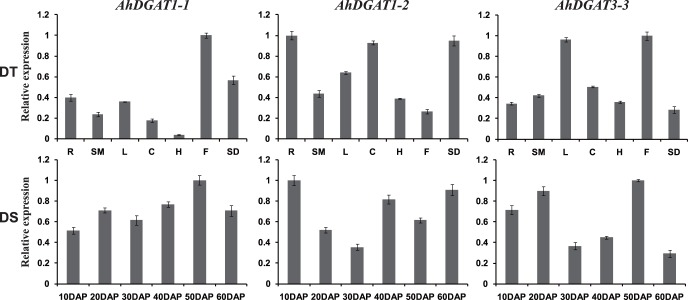
Figure 5. Expression analysis of three AhDGAT genes using qRT-PCR in seven peanut tissues and at six stages of seed development.
DT (different tissues): R, root; SM, stem; L, leaf; C, cotyledons; H, hypocotyls; F, flower; SD, seed. DS (10 to 60 DAP): six developmental stages of seeds. The relative mRNA abundance was normalized with respect to the peanut AhACT11 gene. The bars were standard deviations (SD) of three technical repeats.

