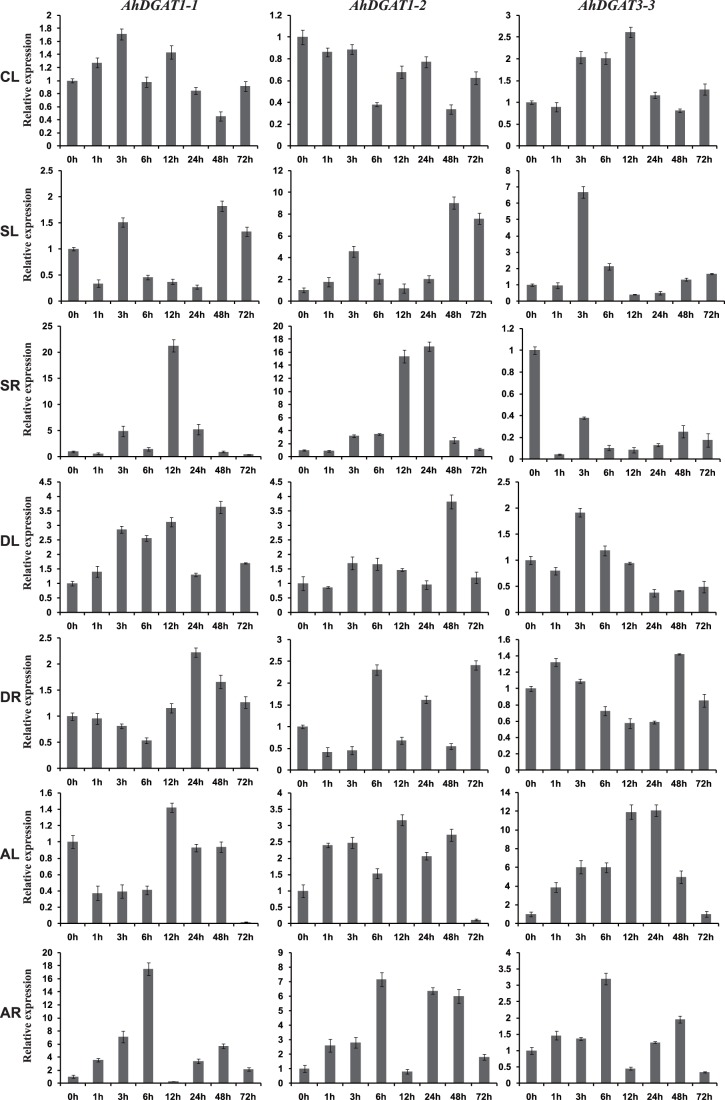
Figure 6. Expression analysis of three AhDGAT genes using qRT-PCR under different stresses.
CL (0 h to 72 h), leaves exposed to cold (4°C) treatment. SL (0 h to 48 h), leaves exposed to high salt (200 mM NaCl) treatment. SR (0 h to 72 h), roots exposed to high salt (200 mM NaCl) treatment. DL (0 h to 72 h), leaves exposed to 20% PEG-6000 treatment. DR (0 h to 72 h), roots exposed to 20% PEG-6000 treatment. AL (0 h to 72 h), leaves exposed to 100 uM ABA treatment. AR (0 h to 72 h), roots exposed to 100 uM ABA treatment. The relative mRNA abundance was normalized with respect to the peanut AhACT11 gene. The bars were standard deviations (SD) of three technical repeats.

