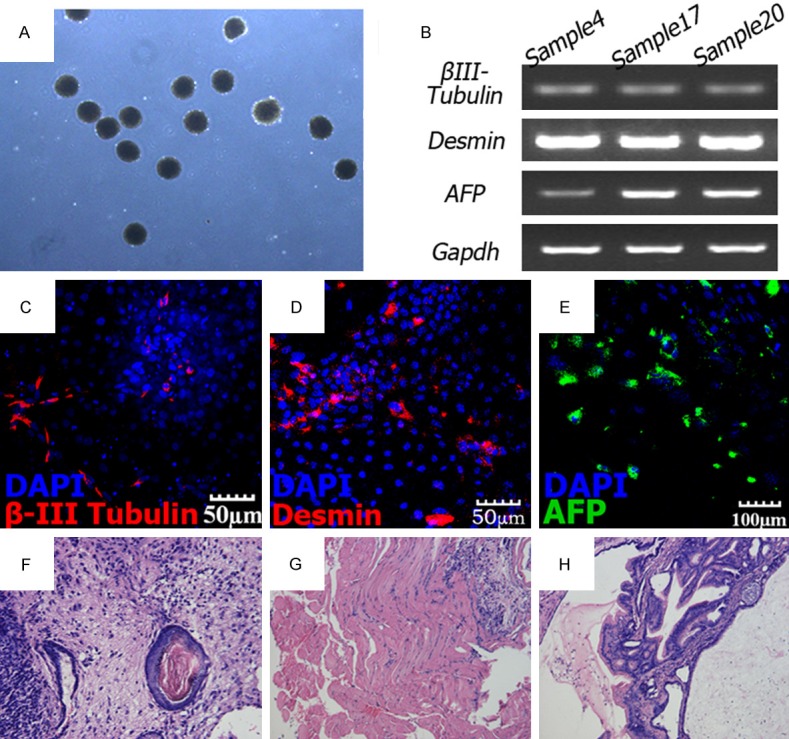
Figure 6.

Differentiation potential of hESCs. (A) EB formation of hESCs. (B) RT–PCR analysis of various germ layer markers from EB samples. Representative results of EB samples derived from hESCs cultured on three hAF-AFSCs lines are shown. (C) β-III Tubulin (ectoderm), (D) Desmin (mesoderm) and (E) AFP (endoderm). (F) Skin keratin pearl (ectoderm); (G) muscle (mesoderm) and (H) intestinal epithelia (endoderm) tissues.
