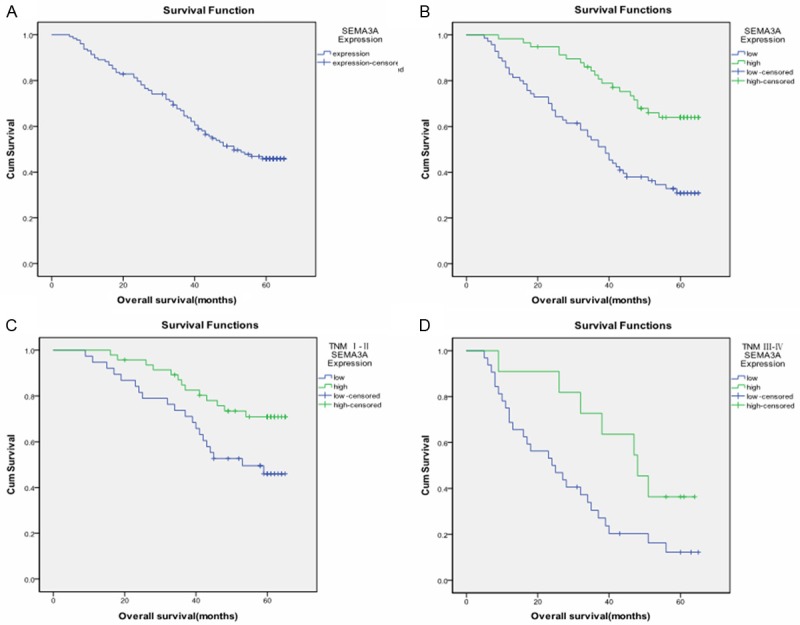
Figure 4.

Comparison of different overall survival cumulative Kaplan-Meier curves for patients grouped by immunohistochemical levels of SEMA3A. A. Kaplan-Meier curves for overall survival (OS) of the 128 gastric cancer patients; B. Kaplan-Meier curves for OS in gastric cancer patients with low level and high level SEMA3A expression (χ 2 = 16.338, P < 0.001); C. Kaplan-Meier curves for OS in early stage (stage I and II) gastric cancer patients with low level and high level SEMA3A expression(χ 2 = 5.435, P = 0.020 ); D. Kaplan-Meier curves for OS in advanced stage (stage III and IV) gastric cancer patients with low level and high level SEMA3A expression (χ 2 = 4.648, P = 0.031).
