
Figure 4.
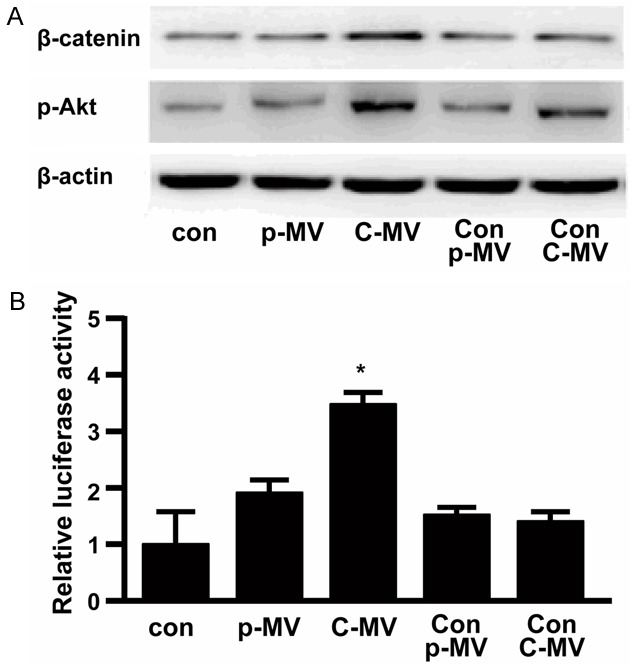
A. Western blotting demonstrating changed β-catenin and phosphorylated Akt expression in endothelial cells treated with different MVs conditions. con: non-treated cells; p-MV: cells treated with plasma MV from GBM patient; C-MV: cells treated with CSF MV from GBM patient; Con-p-MV: cells treated with plasma MV from control volunteer; Con-C-MV: cells treated with CSF MV from control volunteer. The experiment was performed three times with similar results. β-actin was measured as a loading and lysis control. B. Relative luciferase activity driven by TCF-responsive promoter in differently treated cells are shown.