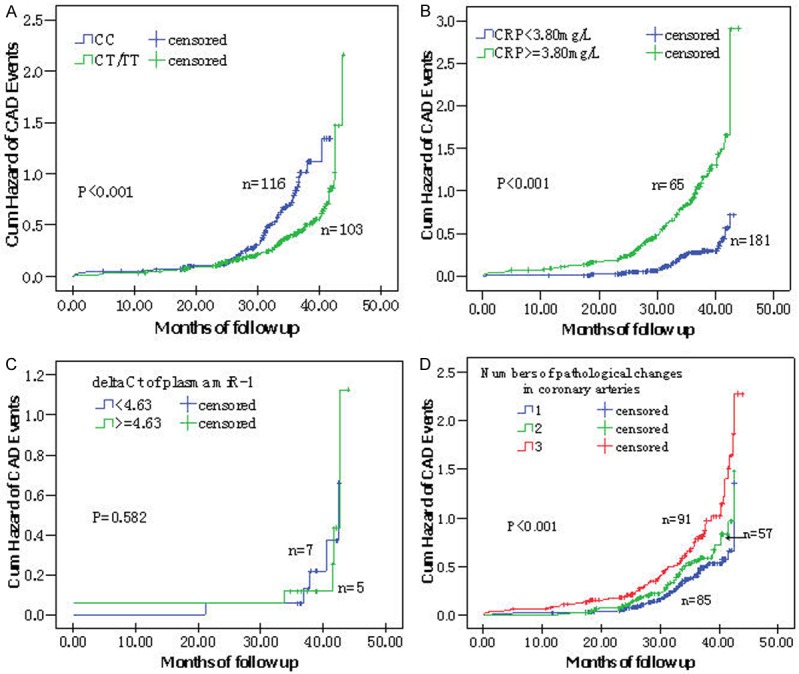
Figure 2.

Kaplan-Meier survival curves of cardiovascular events in CAD patients with different genotypes, CRP levels, circulating miR-1 levels and numbers of pathological changes in coronary arteries. A: rs9548934 C→T, CC vs. CT/TT; B: CRP < 3.80 mg/L vs. ≥ 3.80 mg/L; C: Delta Ct of plasma miR-1 < 4.63 vs ≥ 4.63; D: Numbers of pathological changes in coronary arteries: 1 vs. 2 vs. 3.
