
Figure 3.
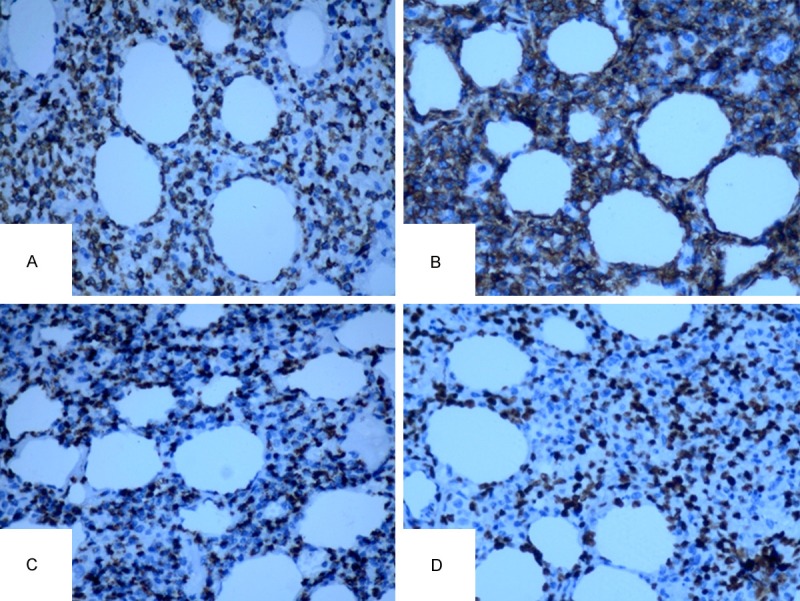
A: Tumor cells were positive for CD3; B: Strong expression of CD56; C: Tumor cells were positive for TIA-1; D: High proliferative activity of Ki-67. (IHC, DAB staining, ×200).
Official websites use .gov
A
.gov website belongs to an official
government organization in the United States.
Secure .gov websites use HTTPS
A lock (
) or https:// means you've safely
connected to the .gov website. Share sensitive
information only on official, secure websites.
A: Tumor cells were positive for CD3; B: Strong expression of CD56; C: Tumor cells were positive for TIA-1; D: High proliferative activity of Ki-67. (IHC, DAB staining, ×200).