
Figure 2.
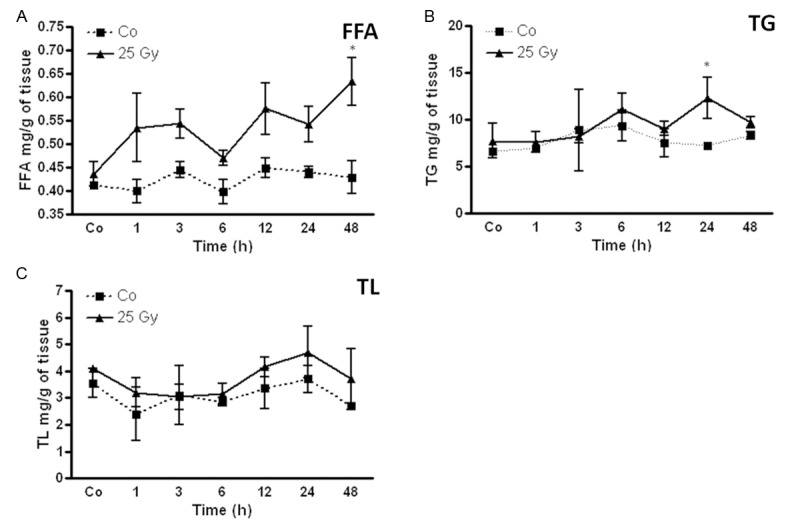
Amount of (A) free fatty acids (FFA) (B) triglyceride (TG) and (C) total lipids (TL) concentration in the liver tissue lysate of irradiated rat liver compared to the sham-irradiated controls for each time points. Values on y-axis are concentration values of FFA, TG and TL measured compared to sham-irradiated controls. Results represent mean value ± S.E.M. of five animals. *P < 0.05.