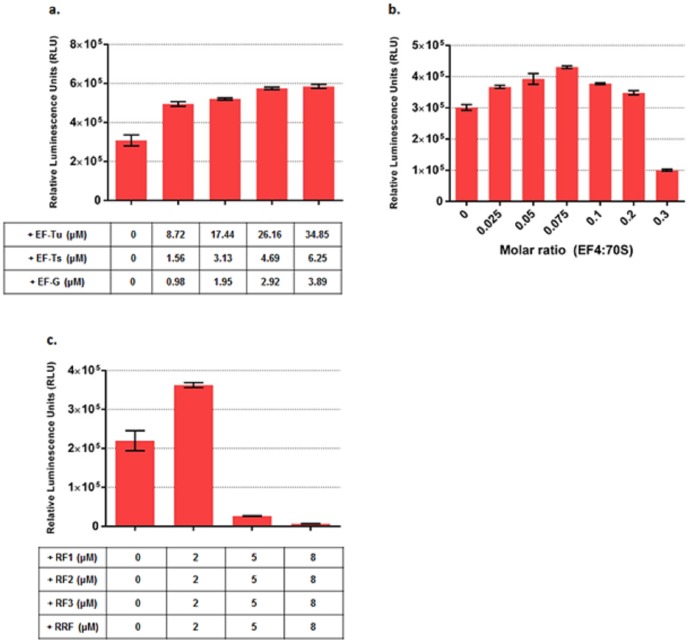
Figure 1. Optimization of PURE system as measured by active Fluc produced by supplementing different concentrations of EF-Tu, Ts, G; EF4; RF1, 2, 3 and RRF.
(a). Active Fluc produced at different EF-Ts, Tu and G concentrations. The table below shows the actual concentration increase of EF-Ts, Tu and G in the PURE system. (b). Active Fluc produced at different EF4 concentrations. (c). Active Fluc produced at different RF1, 2, 3 and RRF concentrations. The table below shows the actual concentration increase of RF1, 2, 3 and RRF in the PURE system. Fluc activities were measured in relative luminescence unit by luciferase assay and PURE system reaction without supplement was set as control. Error bars are ± standard deviations, with n = 3.

