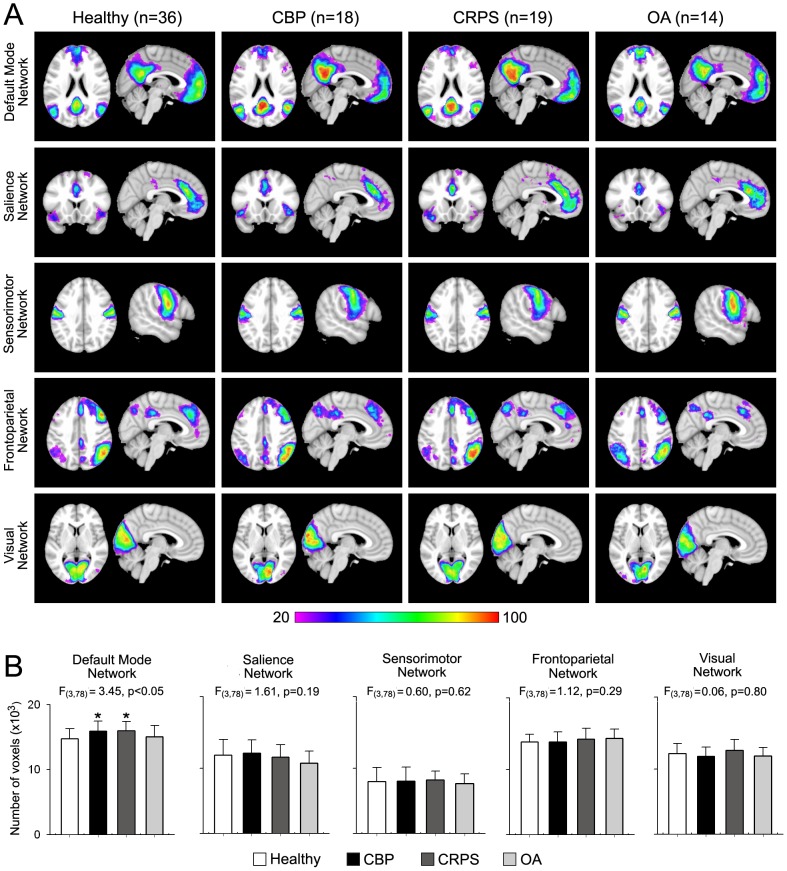
Figure 1. Spatial properties of resting state networks in three chronic pain patient groups and in healthy controls.
(A) Percent spatial overlap of five resting state networks (RSNs) for healthy and pain patient groups. Colors represent percentage of subjects whose best fit component overlap at each voxel. Red denotes much overlap, while purple denotes little overlap. Overall, All RSNs show similar spatial representation across all groups with the exception of the default mode network (DMN), which exhibits larger overlap in the precuneus and posterior cingulate and less overlap in medial prefrontal cortex for CBP and CRPS groups. (B) Mean ± S.E.M. of number of voxels (z-score >3.0) of each RSN. The DMN is the only RSN that differs in size across groups (F3,78 = 3.45, p<0.05), with the CBP and CRPS groups having a larger DMN compared to controls (Post hoc test, *p<0.05 vs controls).

