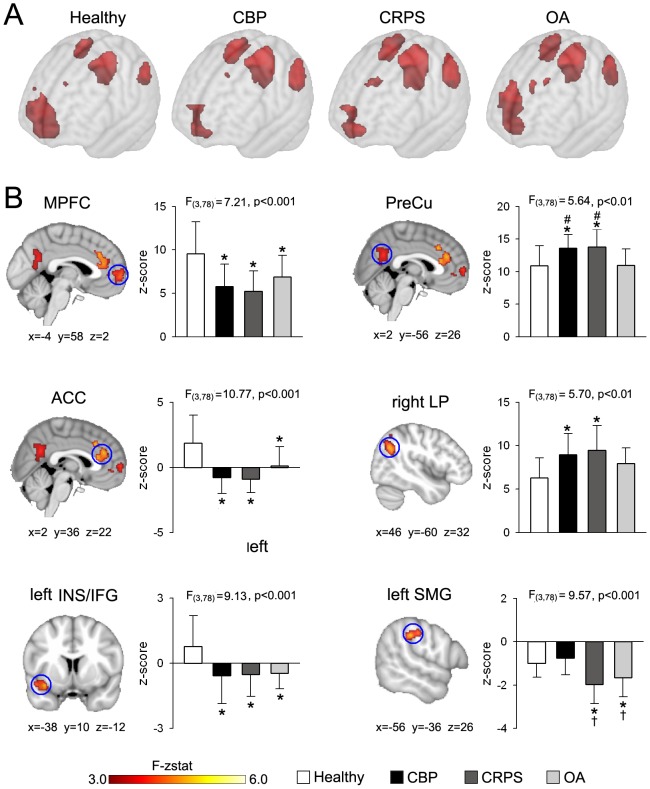
Figure 2. The DMN exhibits divergent connectivity properties across chronic pain patient groups.
(A) Brain maps show the group average spatial representaion of the DMN for all groups (average map thresholed at z-score >4.0). CBP and CRPS patients show decreased MPFC and increased PreCu and left and right LP representaion within the DMN compared to healthy subjects. (B) Maps illustrate clusters of significantly different connectivity for the DMN using a whole-brain voxelwise ANOVA (mixed effects analysis, f-zscore >3.0, corrected for multiple comparisons by cluster threshold p<0.01). All patient groups show decreased connectivity in MPFC (F3,78 = 7.21, p<0.001), ACC (F3,78 = 10.77, p<0.001), and left anterior INS/IFG (F3,78 = 9.13, p<0.001). CBP and CRPS subjects display increased connectivity in PreCu (F3,78 = 5.64, p<0.01), compared to healthy controls and OA patients, and in right LP (F3,78 = 5.70, p<0.01) compared to healthy controls. In addition, the left SMG exhibits stronger negative connectivity in CRPS and OA groups, than in CBP and control subjects (F3,78 = 9.57, p<0.001). Bars represent mean ± S.E.M. of normalized connectivity strength (Post hoc test: *p<0.05 vs healthy; †p<0.05 vs CBP; ‡p<0.05 vs CRPS; #p<0.05 vs OA).

