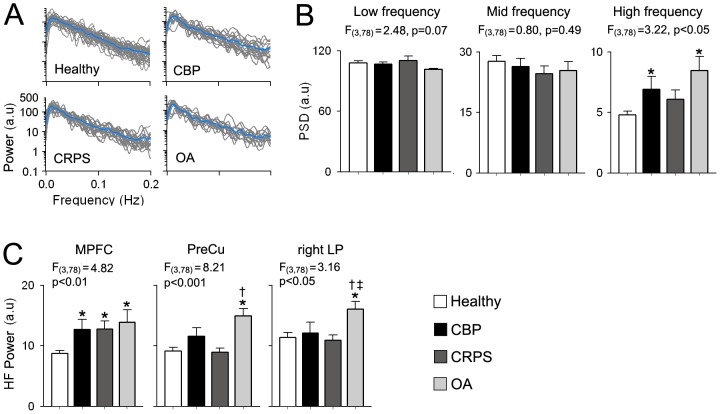
Figure 3. The DMN shows chronic pain type specific increased high frequency oscillations.
(A) Individual power spectra for the DMN BOLD oscillations superimposed separately for each group. Blue traces represent group averages. (B) Bar graphs show the mean ± S.E.M. power from the DMN time courses for the low (0.01–0.05 Hz), mid (0.05–0.12 Hz) and high (0.12–0.2 Hz) frequency bands. CBP and OA patients exhibit increase in power for the high frequency (HF) band compared to controls (F3,78 = 3.22, p<0.05, corrected for gender and age). (C) Regions within the DMN show differential changes in HF power. All patient groups show increased HF power in MPFC (F3,78 = 4.78, p<0.01) compared to healthy controls. On the other hand, only OA patients show increases in HF power in PreCu (F3,78 = 8.21, p<0.001) compared to CRPS patients and controls and in right LP (F3,78 = 3.16, p<0.05) compared to all groups. (Post hoc test: *p<0.05 vs healthy; †p<0.05 vs CBP; ‡p<0.05 vs CRPS; #p<0.05 vs OA).

