
Figure 5. DMN spectral power and phase changes are related to pain duration in specific patient groups.
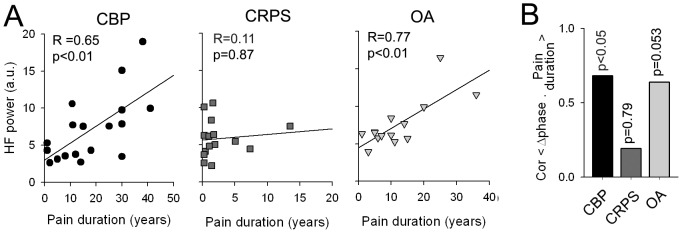
(A) The DMN high frequency spectral power shows significant positive correlation to pain duration in CBP (R = 0.65, p<0.01) and OA (R = 0.77, p<0.01), but not in CRPS (R = 0.11, p = 0.87). (B) Phase differences between the DMN and frontoparietal network shows high correlation to pain duration in CBP (R = 0.68, p<0.05), a positive trend in OA (R = 0.64, p = 0.053) and no correlation in CRPS (R = 0.19, p = 0.79). Note pain duration is significanlty less in CRPS, than in CBP (t-value = −4.56, p<0.01) and OA (t-value = −3.34, p<0.01).