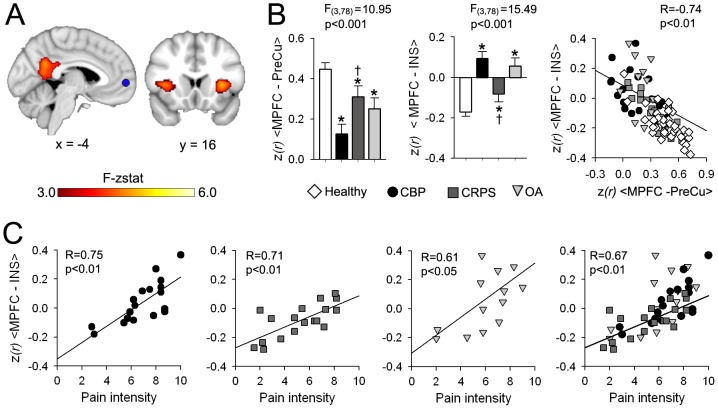
Figure 6. MPFC exhibits connectivity changes in proportion to intensity of pain.
(A) Brain map illustrates regions showing significantly different correlation to the MPFC across all groups using a whole-brain voxelwise ANCOVA corrected for age and gender(mixed effects analysis, f-zscore >3.0, corrected for multiple comparisons by cluster threshold p<0.01). Differences in MPFC connectivity between groups were restricted to the bilateral anterior INS and PreCu. (B) Bar graphs show the mean ± S.E.M. normalized correlation (z(r)) for MPFC-PreCu and MPFC-INS for all groups. All patients show significant decrease in MPFC-PreCu corelletion (F3,78 = 7.18, p<0.001, corrected for gender and age) and increase in MPFC-INS correlation (F3,78 = 8.38, p<0.001). In addition, CBP patients showed lower MPFC-PreCu and higher MPFC-INS compared to CRPS patients. Right scatter plot shows the relationship between MPFC-INS and MPFC-PreCu association. Increase in the MPFC-INS correlation was inversly related to MPFC-DMN connectivity across all subjects (R = −0.74, p<01). (C) MPFC-INS connectivity showed high correlation to pain intesity in CBP (R = 0.75, p<0.01), CRPS (R = 0.71, p<0.01) and OA (R = 0.61, p<0.05). This correlation was maintaintended when examined across all patient groups (R = 0.67, p<0.01). (Post hoc test: *p<0.05 vs healthy; †p<0.05 vs CBP).

