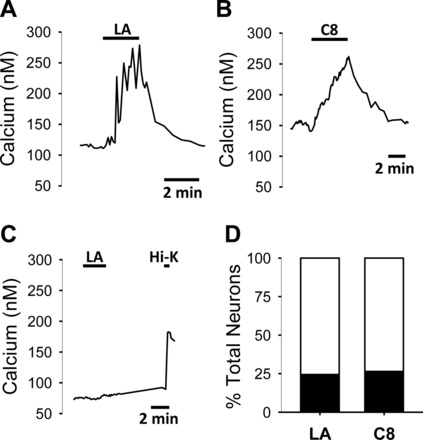
Fig. 1.

Representative calcium traces in isolated nodose neurons showing responses to linoleic acid (LA; A), caprylic acid (C8; B), and a neuron not responsive to LA, but that did respond to depolarization with a high K+ bath (C). The labeled lines above the data trace indicate when LA (10 μM), C8 (10 μM), or the high KCl bath (55 mM K+) was applied to the neurons. D: percent distribution of neurons responding (black) or not responding (open) to LA (83 responding and 243 insensitive) and C8 (29 responding and 77 insensitive). There was no significant difference between the distribution of LA- and C8-responsive neurons (χ2 analysis).
