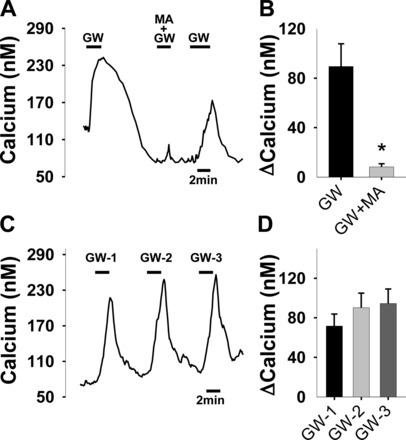
Fig. 5.

The effect of MA (6 mM) on the calcium response induced by GW (40 μM) (A and B) and the effect of repeated GW treatments on calcium response (C and D). A: representative calcium trace. B: summary of the effect (n = 16, *P < 0.001 paired t-test). C: representative calcium trace by three GW treatments (40 μM; 2 min each). B: summary of the effect (n = 12; P > 0.4, one-way ANOVA).
