
Fig. 2.
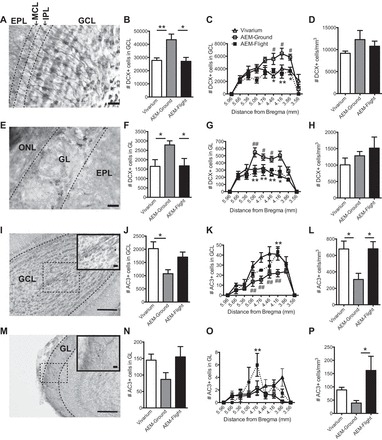
AEM-Ground mice have more DCX+ immature neurons and reduced cell death relative to AEM-Flight mice and Vivarium mice. A: representative photomicrograph of the GCL in the OB stained for DCX and counterstained with Fast Red. Scale bar = 50 μm. B: no. of immature neurons, assessed by DCX immunoreactivity, in the GCL is significantly increased in AEM-Ground vs. Vivarium mice. This AEM-induced increase in DCX+ cell number is significantly decreased in AEM-Flight mice. C: DCX+ cells in the GCL plotted at different distances from bregma (+5.96 to 3.56 mm from bregma). D: no. of DCX+ cells/mm3 in the GCL was not significantly different among the 3 groups. E: representative photomicrograph of the GL stained for DCX and counterstained with Fast Red. Scale bar = 50 μm. F: DCX+ cells in the GL are significantly increased in AEM-Ground vs. Vivarium mice. This AEM-induced increase in DCX+ cell number is significantly decreased in AEM-Flight mice. G: DCX+ cell numbers in the GL plotted at different distances from bregma (+5.96 to 3.56 mm from bregma). H: no. of DCX+ cells/mm3 in the GL was not significantly different among the 3 groups. I: representative low-magnification photomicrograph (100× magnification) of the GCL in the OB stained for activated caspase 3 (AC3) and counterstained with Fast Red. Scale bar = 100 μm. I, inset: a higher magnification (400× magnification) image of the boxed area. Scale bar = 20 μm. J: no. of apoptotic cells, as assessed by AC3+ immunoreactivity, in the GCL is significantly decreased in AEM-Ground vs. Vivarium mice. AEM-Flight mice also exhibited a strong trend for increased AC3+ cell number vs. AEM-Ground mice. K: AC3+ cell numbers in the GCL plotted at different distances from bregma (+5.96 to 3.56 mm from bregma). L: AEM-Ground mice had significantly fewer AC3+ cells/mm3 in the GCL vs. Vivarium and AEM-Flight. M: representative low-magnification photomicrograph (100× magnification) of the GL stained for AC3 and counterstained with Fast Red. Scale bar = 100 μm. M, inset: a higher magnification (400× magnification) image of the boxed area. Scale bar = 20 μm. N: there is a trend for fewer AC3+ cells in the GL of AEM-Ground mice vs. Vivarium mice, which is not seen in AEM-Flight mice. O: AC3+ cells in the GL plotted at different distances from bregma (+5.96 to 3.56 mm from bregma). P: AEM-Flight mice had significantly more AC3+ cells vs. AEM-Ground but not Vivarium mice. All data represent means ± SE. All total and cell density DCX+ and AC3+ data (B, D, F, H, J, L, N, P) analyzed by one-way ANOVA with Tukey's post hoc test. N = 4–6/group. *P < 0.05, **P < 0.01. All bregma data (C, G, K, O) analyzed by two-way ANOVA with Sidak's post hoc test. N = 4–6/group. *P < 0.05, **P < 0.01, AEM-Flight vs. AEM-Ground. #P < 0.05, ##P < 0.01, AEM-Ground vs. Vivarium.