
Fig. 1.
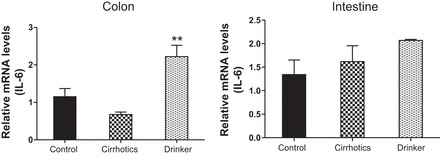
IL-6. Comparison of the fold change in the mRNA expression levels between the controls (control) compared with nonalcoholic cirrhotic subjects (cirrhotic) and actively drinking cirrhotic patients (drinker). Significant differences, **P < 0.01.