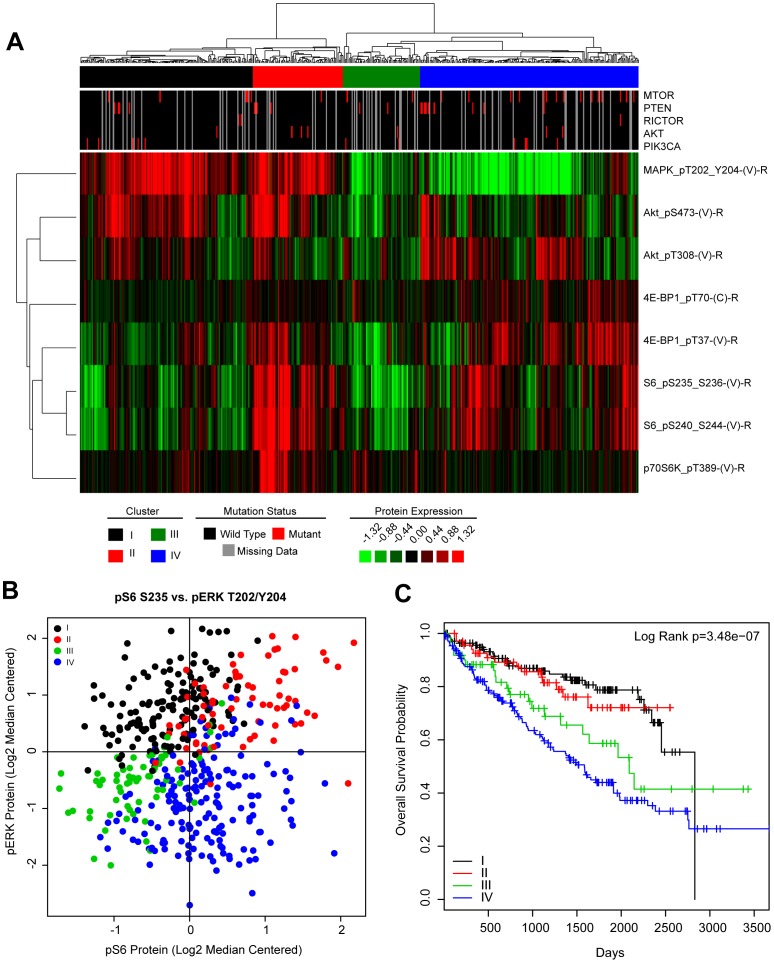
Figure 5. Subclasses of RCC can be defined by MEK and mTOR pathway activation.
(A) TCGA KIRC RPPA data was log2 transformed, median centered. Tumors were then hierarchically clustered and the indicated subgroups were determined based on expression patterns of the indicated phosphoproteins. Mutational data for mTOR pathway related genes were annotated in the upper tracks. (B) Scatter plot of TCGA KIRC tumors based on expression of pS6 and pERK. Each dot indicates a tumor. The MEK-PI3K/mTOR subclasses defined in (A) are indicated by color. (C) Patients harboring tumors within each MEK-PI3K/mTOR subclass were evaluated for differences in overall survival by the Log Rank test and shown as a Kaplan-Meier plot of overall survival.

