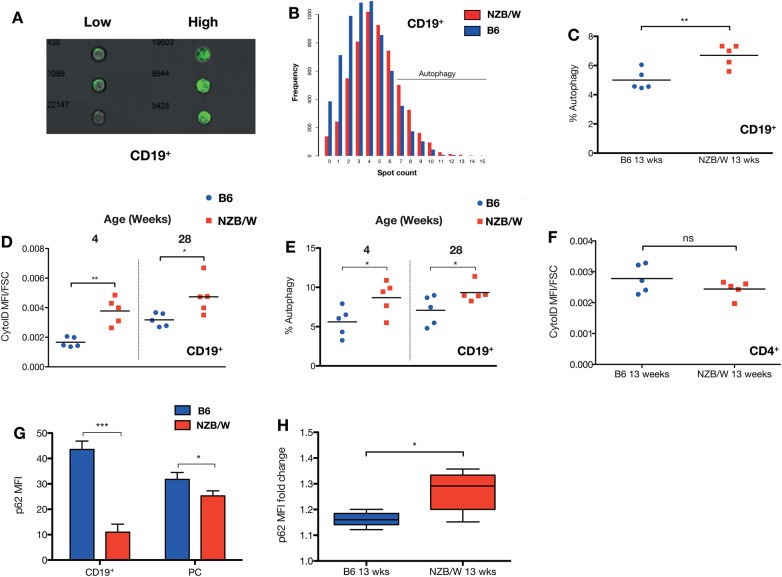
Figure 1.
Autophagy in murine lupus. Autophagy in splenic NZB/W CD19+ B cells was compared with control C57BL/6 mice. (A) Representative multispectral imaging flow cytometry (MIFC) images of B cells with high and low numbers of LC3+ autophagosomes. (B) Example distributions of LC3+ punctae in diseased versus control mice at 13 weeks of age, with gating of autophagy-positive cells (defined as ≥7 spots per cell). There are increased numbers of LC3+ autophagosomes in the CD19+ B cells of NZB/W compared with control mice at 13 weeks (post-disease onset) (C). The number of autophagosomes measured using autophagosomotropic dye (D) or MIFC (E) increases with age, but a difference between the mice is present even at 4 weeks, before disease has developed. There was no difference in autophagosomotropic dye uptake in CD4+ T cells, at 13 weeks (F). Each data point represents an individual mouse. The horizontal bars denote mean. (G) There is decreased basal p62 expression, measured by intracellular FACS in splenic CD19+ B and CD19+/−CD138+ plasma cells in 13-week-old NZB/W mice. To demonstrate accumulation of the autophagic substrate p62, isolated splenocytes were incubated in complete RPMI with 100 nM bafilomycin A1 for 3 h (H). n=5 mice per group. Fold change in p62 MFI compared with untreated cells is shown. *p<0.05; p<0.01; ***p<0.001.

