
Figure 2.
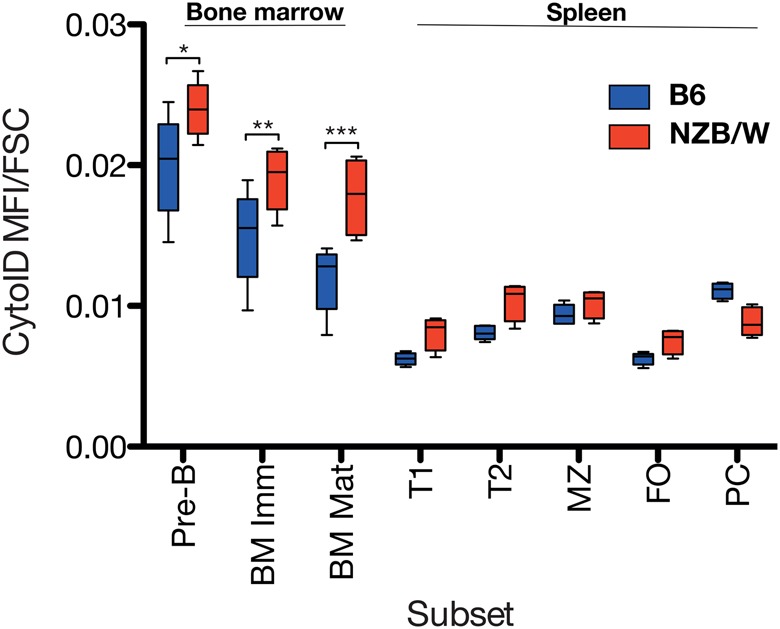
Autophagosome density in mouse B cell subsets. Distribution of CytoID MFI in B cell subsets from bone marrow (BM) and spleens of 13-week-old NZB/W mice and age matched controls. Pre-B (CD19+IgM−IgD−), immature B (BM Imm, CD19+IgD−IgM+), mature B (BM Mat, CD19+IgD+IgM+), T1 (CD19+IgM+ IgD−CD23−CD21−), T2 (CD19+IgM+ IgD+CD23+CD21+), marginal zone (MZ, CD19+IgM+IgD−CD23−CD21hi), follicular (FO, CD19+IgM−IgD+CD23hiCD21+), and BM plasma cell (CD19+/−CD138+) subsets are illustrated. n=5 mice per group. Box and whisker plots denote maximum and minimum, IQR, and median. *p<0.05; **p<0.01; ***p<0.001.