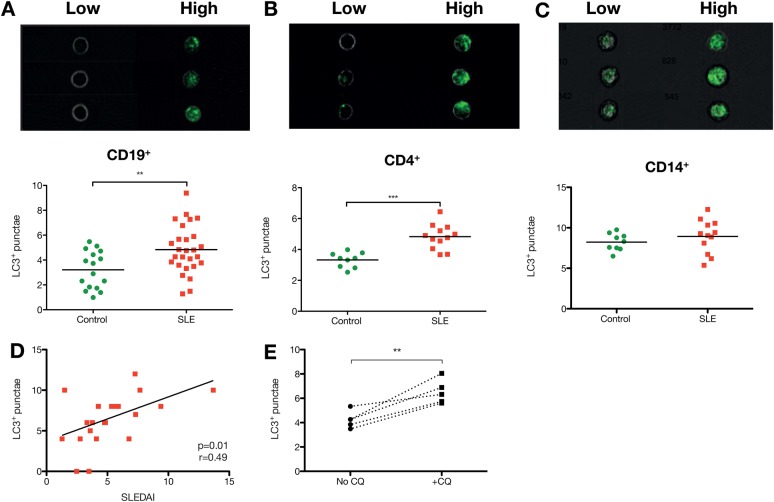
Figure 3.
Autophagy in systemic lupus erythematosus (SLE) patients versus healthy controls. (A–C) Representative images of CD19+ B cells, CD4+ T cells, and CD14+ monocytes with high and low numbers of LC3+ punctae, and comparison with healthy controls. CD19+ B cell LC3+ puncta count is correlated with SELENA-SLEDAI disease activity index (D). (E) Increased autophagic flux in SLE patients. Isolated CD19+ B cells from patients were incubated with 10 μM chloroquine in complete RPMI media for 2 h, and then analysed by multispectral imaging flow cytometry. Each point represents one individual patient or healthy donor. **p<0.01; ***p<0.001.

