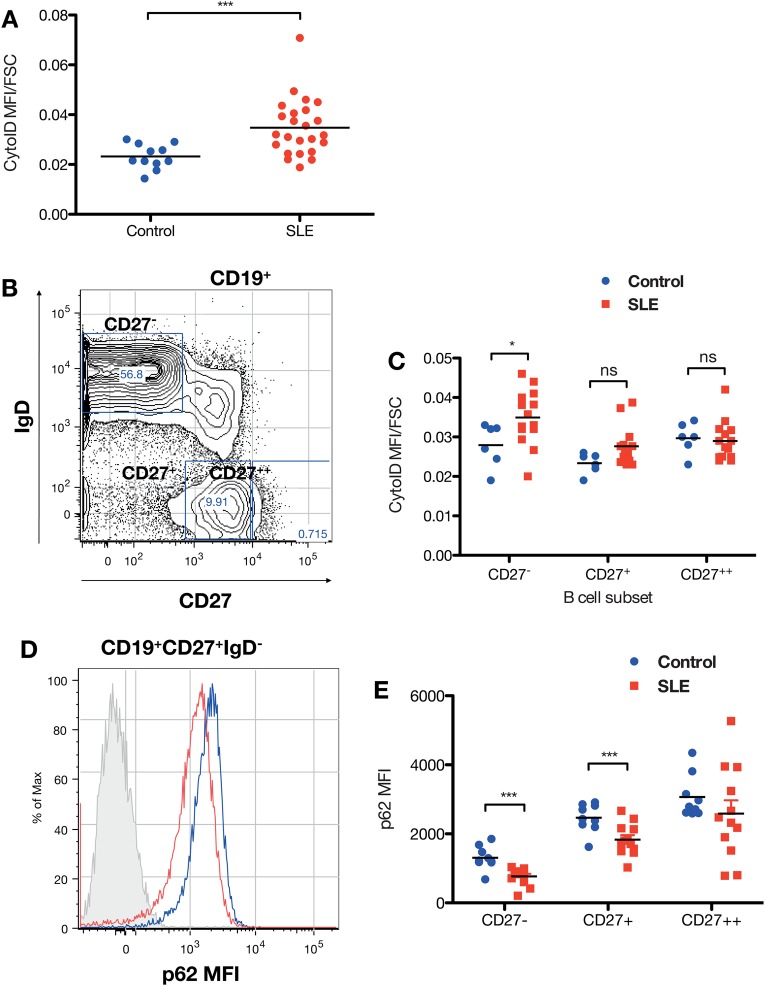
Figure 4.
Differential autophagy in human B cell subsets. (A) The increase in autophagosome density seen in CD19+ B cells with multispectral imaging flow cytometry is also demonstrated using autophagosomotropic dye. (B) Gating strategy for naïve (CD27−IgD+), memory (CD27+IgD−), and plasmablast (CD27++IgD−) B cells, and differential autophagy by subset (C). (D) Example histogram of p62 MFI in naïve B cells of systemic lupus erythematosus (red line) compared with control (blue line). (E) Differential p62 expression in B cell subsets. *p<0.05; ***p<0.001.

