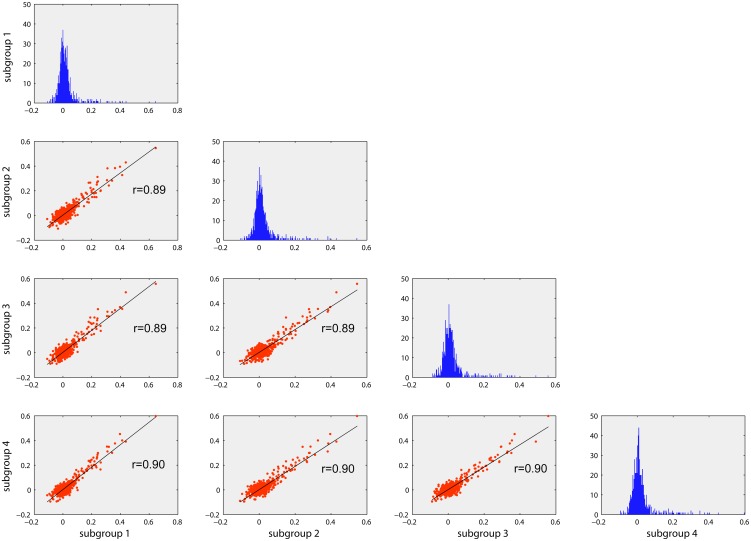
Figure 3. Reproducibility of FC across subjects.
The histograms (in blue) represent the distribution of the partial correlation coefficients (z-transformed) for each of the four randomly partitioned subject groups. Scatter plots indicating high correlation (r>0.85) of the pair-wise FC values between the groups suggest high reproducibility of FC at a group level.

