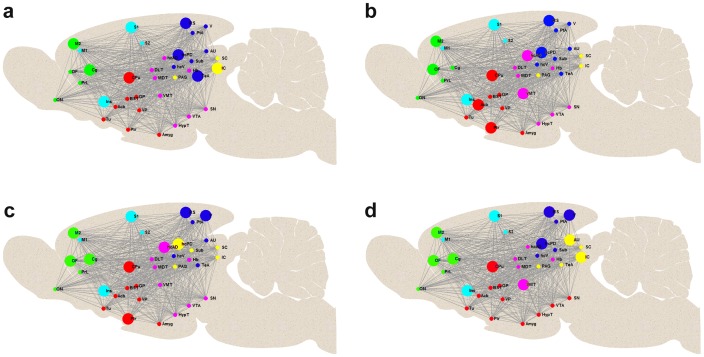
Figure 5. Modular organization in 4 different groups.
Group plots with high modular similarity (low variability) in subjects randomly split into four groups (a–d) visualized on schematic mid sagittal sections of the rat brain. Network hubs are depicted by larger circles. The colors used for the sub-networks of the six functional modules, as identified by the modularity partitioning algorithm (see methods), are analogue to those used in Figure 4c. For abbreviations of brain regions see Figure 1.

