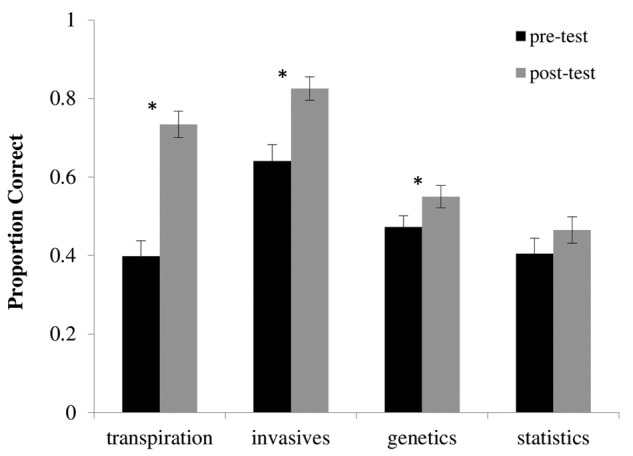
Figure 2.

Mean (±1 SE) proportion of correct answers to questions about plant transpiration, invasive species, population genetics, and statistics on pre- and posttests. Results of Tukey's post hoc tests are shown; asterisks indicate statistically significant differences between means. Students were asked two questions per topic. n = 270.
