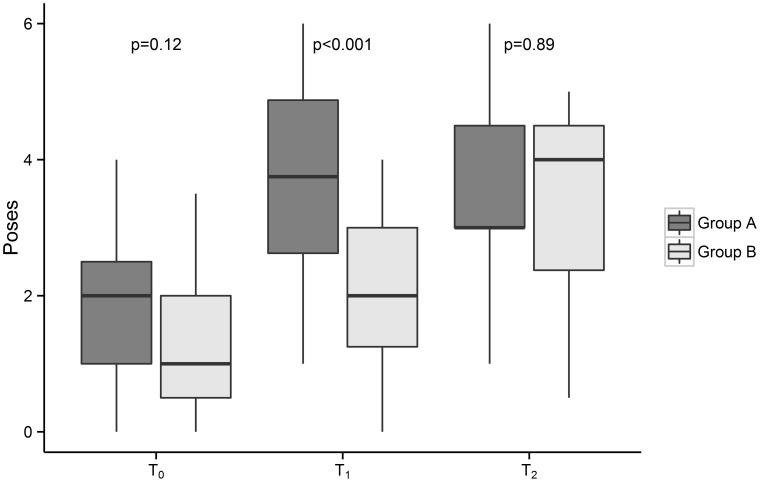
Figure 4. Number of poses performed correctly per hand hygiene action, by study group and study phase.
Group A was exposed to the intervention for four weeks between baseline (T0) and the first follow-up (T1). Group B was exposed to the invention for 12 weeks between the first follow-up (T1) and the second follow-up (T2). Median and interquartile ranges are represented by the horizontal line and box, respectively. Upper and lower whiskers extend to minimum and maximum values that lie within 1.5 times the interquartile range from the 75th and 25th percentile, respectively. Each p-value relates to the null hypothesis that the two groups perform the same number of poses correctly at that time point.

