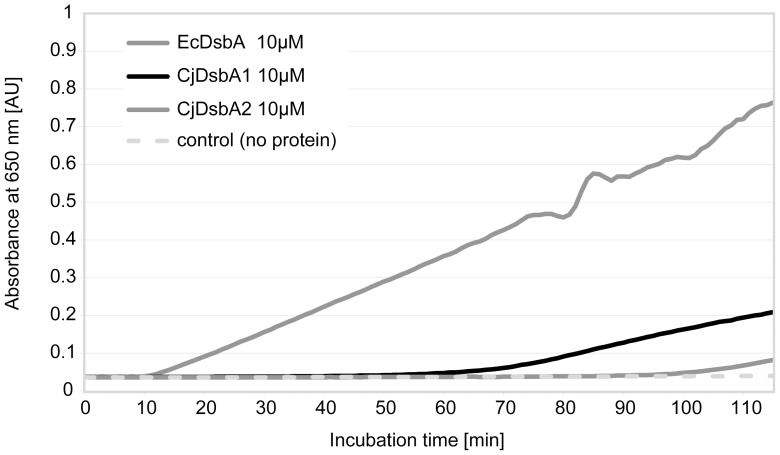
Figure 3. Insulin reduction assay for CjDsbA1 and CjDsbA2.
The reaction mixture contained 150 µM insulin in potassium phosphate buffer, pH 7.0 and 2 mM EDTA. The assay was performed in the absence (▪) or presence of 10 µM EcDsbA (♦), CjDsbA1 (⁃) and CjDsbA2 (▴). Reactions started by adding DTT to the final concentration of 0.33 mM and the changes in the absorbance at 650 nm as a function of time were measured. The figure presents a representative result.

