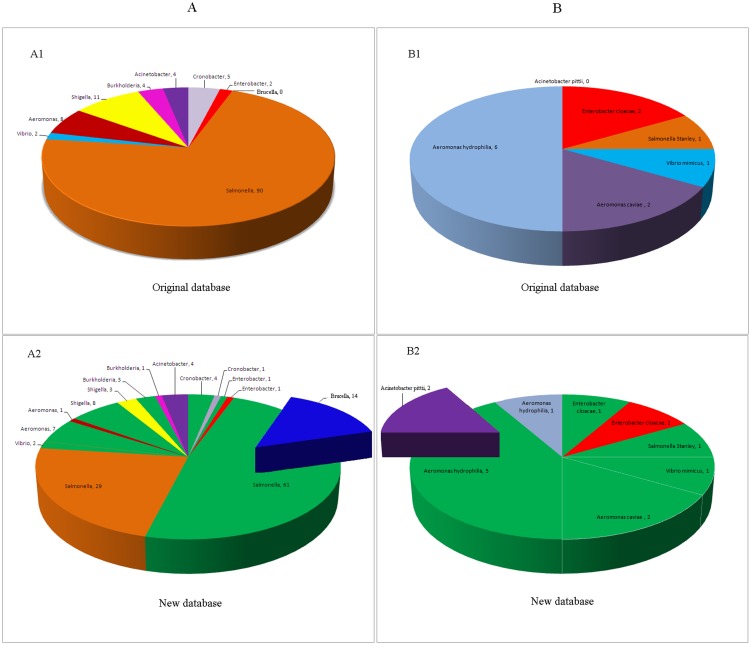
Figure 2. A statistical chart indicating misidentification rates before and after database expansion.
A: Distributions of pathogen misidentifications (after excluding 24 strains from single-strain species) generated using the ORD and the NRD; A1: The distribution of pathogen misidentifications generated using the ORD for 995 strains; A2: The distribution of pathogen misidentifications generated using the NRD for 995 strains; B: Distributions of pathogen misidentifications (after excluding 24 strains from single-strain species and strains without reference spectra in the ORD) generated using the ORD and the NRD; B1: The distribution of pathogen misidentifications generated using the ORD for 631 strains; B2: The distribution of pathogen misidentifications generated using the NRD for 631 pathogenic strains. Green indicates the strains that were misidentified using the ORD but accurately identified by searching the NRD. Bold text indicates strains that were misidentified by the NRD.

