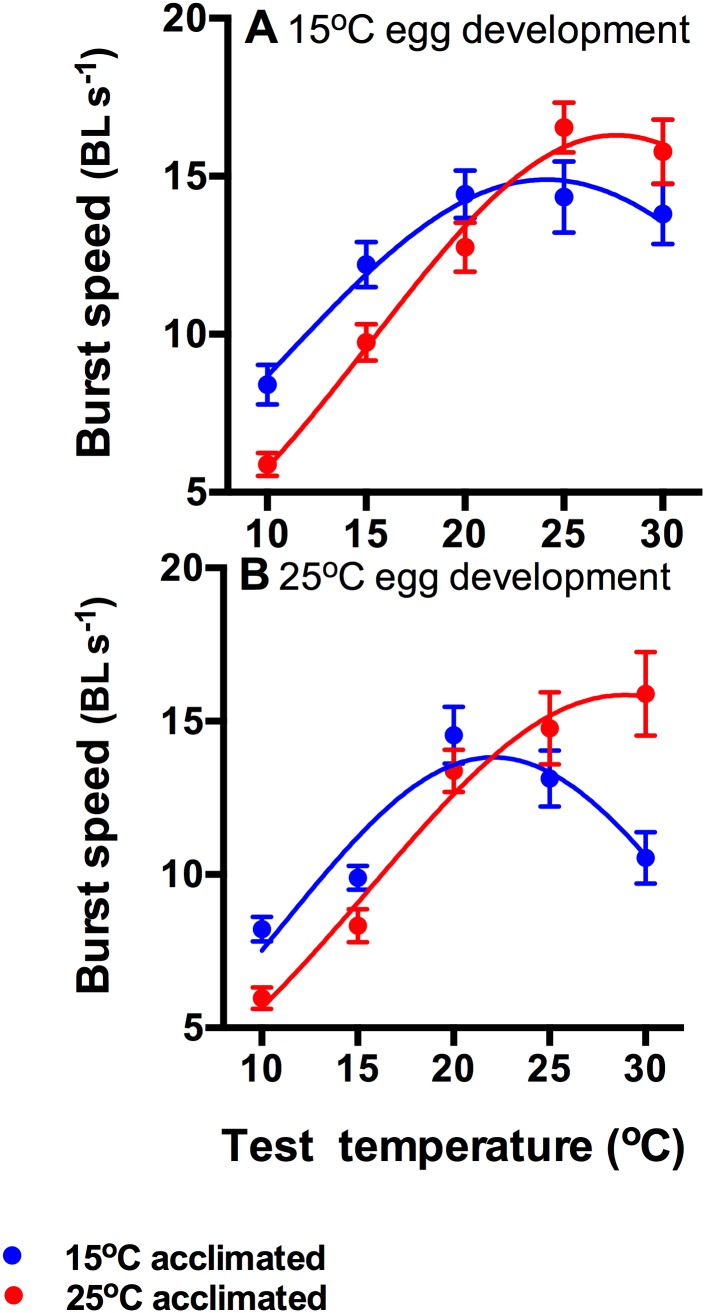
Figure 3. Burst swimming speed (mean ± s.e.) of tadpoles hatched from eggs developed at 15°C (A) and at 25°C (B) that have subsequently been acclimated to 15°C (blue circles) or 25°C (red circles).
The lines show Gaussian reaction norms fitted to the data from cold (blue lines) and warm (red lines) acclimated animals. The amplitudes, breadths and modes of the reaction norms were determined by an interaction between incubation and acclimation temperatures (Table 1). N = 18 tadpoles per treatment and test temperature.

