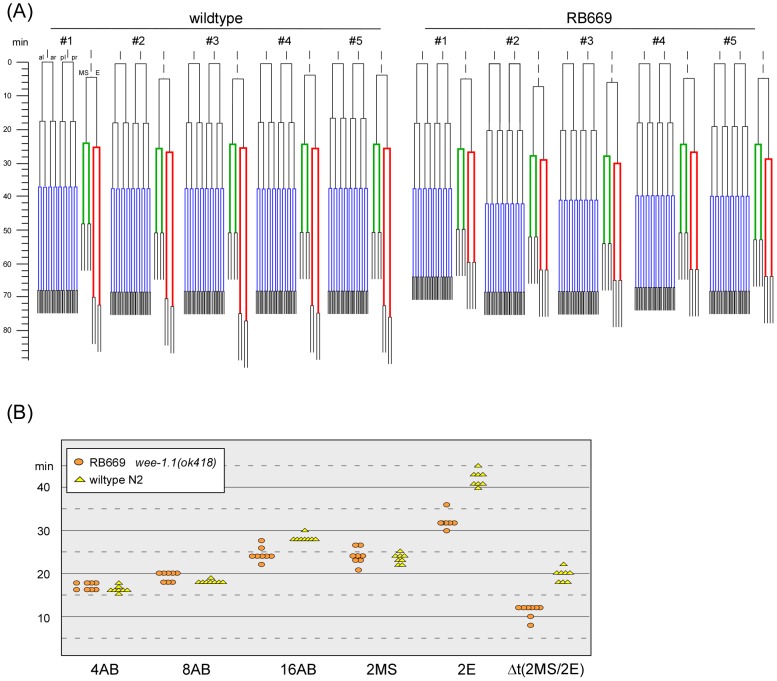
Figure 4. 4D lineaging analyses of wildtype and wee-1.1(ok418) mutant embryos.
(A) Lineaging results for the AB, MS and E lineages are shown for five wildtype embryos (left) and five wee-1.1(ok418) mutant embryos (strain RB669, right). The lineaging results are shown starting from the 3-cell stage to approximately the 50-cell stage. The 2AB to 4AB division is taken as time 0. The 16AB cell cycle is shown in blue, the 2MS cell cycle in green, and the 2E cell cycle in red. (B) Summary of specific cell cycle times for all wildtype and wee-1.1(ok418) mutant embryos examined.

